
Server Logs – what they are, how and where you can view them

In the work of a system administrator, it is often necessary to see the server logs (Server Logs), which tasks the server worked with at a particular time, which actions were performed by users. The reasons for this need may be different:
- Server crash;
- Revealing of illegal actions;
- Analysis of work processes.
All the necessary information can be obtained in the server logs (Server Logs), which are files that contain entries about the various processes, user actions, etc. But to do this, you need to understand where this data is stored and, most importantly, how to work with it.
What are server logs?
In fact, the word “server logs” is a trite transliteration of the phrase “server log,” which translates as “server log.”
There are the following types of logs:
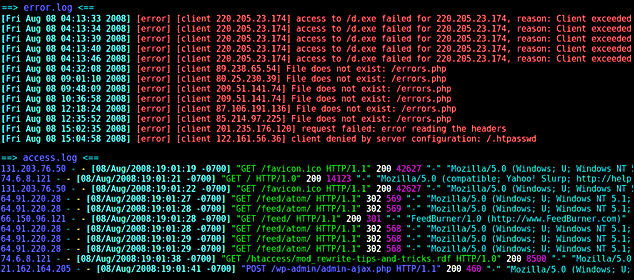
- Errors – records are capturing various failures in the server or when accessing specific functions or tasks. With their help, you can quickly eliminate various bugs and failures;
- Access – records that capture the exact date and time of the connection of a particular user, how he got to the site, etc. Allow you to carry out analytical work, as well as to find vulnerabilities in cases where the resource has tried to hack;
- Other – Records of the work of various components of the server, for example, mail.
Of course, if you do not observe any problems or suspicious moments related to the work of the server, there is no need to frequently review the logs. Nevertheless, experts recommend checking them selectively at least once a year.
On the other hand, if there has already happened some emergency, for example, the site has suddenly begun to produce a large number of errors, undergone a spam attack, or the load on the server has rapidly increased, then studying the logs will quickly understand what the problem is and fix it.
Nevertheless, for the majority of ordinary users, log-file entries are just a strange set of symbols. Therefore, we need to understand how to read them correctly.
How do I read server logs correctly?

In this example, we will look at two types of entries regarding access and error logs, as they are the most frequently accessed when problems occur.
So, the access log entry, from the file access.log:
mysite.biz 25.34.94.132 – – – [21/Nov/2017:03:21:08 +0200] “GET /blog/2/ HTTP/1.0” 200 18432 “-” “Unknow Bot (http://www.unknow.com/bot; [email protected])”
What it means:
- mysite.biz is the domain of the site you are interested in;
- 34.94.132 – The IP address the user used when accessing the site;
- [21/Nov/2017:03:21:08 +0200] – the date, exact time and time zone of the user;
- GET – the request that is sent to retrieve the data. In the case where the user transmits data, the request will be “POST”;
- /blog/2/ – the relative address of the page that was requested;
- HTTP/1.0 – the protocol used;
- 200 – response code to the request;
- 18432 – the amount of data transferred under the request, in bytes;
- Unknown Bot (http://www.unknow.com/bot; [email protected]) – data about the robot or a real person who visited the site. If it is a person, will be displayed OS, type of device, etc. In the specific example, a robot parser belonging to the resource unknow.com visited the site.
Thus, we learned that from IP address 25.34.94.132, on November 21st, 2017, at three hours, twenty-one minutes, and eight seconds, our site was visited by a bot belonging to another web resource. It sent a data request and received 18432 bytes of information.
Now you can block access for bots from this site or from anyone who uses this IP, of course, if necessary.
You can see the error logs in the file with a telling name – error.log. They look like this:
[Sat 1 Oct 18:23:28.719615 2019] [:error] [pid 10706] [client 44.248.44.22:35877]
PHP Notice: Undefined variable: moduleclass_sfx in
/var/data/www/mysite.biz/modules/contacts/default.php on line 13
What does it say here?
- The date, time, and type of error, as well as the IP address the visitor used;
- The event type, in this case, “PHP Notice” (notification), as well as a clarification that in this case, we are dealing with an unknown variable;
- The location of the file with the notification, as well as the line on which it is located.
Simply put, in this case, we have a message that there was an error related to the contact module on October 1st, at 6:23 p.m., 2019.
Of course, even after decoding, the data obtained is not easy to analyze. That’s why, for convenient processing of data from the server logs, different software is used. Such programs include Awstats, Webtrends, WebAlyzer, and many others.
Today there are many paid and free versions of programs for the processing and analysis of log files.
Windows server logs
Windows server logs have an inherently more convenient and structured information output in the form of a simple and clear table.
There are several levels of events:
- Information;
- Details;
- Warning;
- Error;
- Critical.
There is also the ability to quickly filter and sort records, depending on what data you want to get.
SQL Server logs
Today, SQL databases are the most common way to work with large amounts of information. First of all, the logs of the SQL server it is worth examining if you are not sure that some processes have been successfully completed. These processes may be:
- Backup;
- Data recovery;
- Mass changes;
- Various scripts and data processing programs.
You can use SQL Server Management Studio or another text editor to view the logs. The records are organized into logs of the following types:
- Data Collection;
- Database Mail;
- SQL Server;
- Windows Events;
- Job Logs;
- Audit Collection;
- SQL Server, Agent.
In order to access the logs, you must have “securityadmin” rights.
How do I enable or disable server logging?
In order to perform this operation, you need to go into the administrative panel of your hoster. As a rule, in the main menu, there are a section “Log” or “Logs,” where you can enable or disable the recording of data on access granted, errors, etc.
Where are the server logs located?
The location of the logs depends primarily on the operating system you are using.
Server logs with CentOS, or Fedora, are stored in the directory “/var/log/.”
The file names are:
- The error log is “error.log”;
- The nginx log – “nginx”;
- Access log – “log”;
- The main log – “syslog”;
- System boot log – “dmesg”.
MySQL-related error logs are located in the directory “/var/lib/mysql/”, in the file “$hostname.err”.
For Debian and Ubuntu operating systems, server logs are located in the folder “/var/log/,” in the files:
- Nginx – Nginx log;
- /mysql/error.log – error log for MySQL databases;
- Syslog – the main log;
- Dmesg – system load, driver;
- Apache2 – log of the Apache webserver.
As you can see, all Linux-based operating systems tend to have the same server logs and directories.
This is not the case with Windows server logs. If you want to see the logs, you need to log in and press “Win” and “R,” and the event viewer will open, where you can pick up the logs you are interested in.
If you want to view PowerShell logs, you need to open the program and enter the command: “Get-EventLog -Logname ‘System.'”
All the data will be displayed in a convenient table.
An example of working with server logs
Imagine that you suddenly discovered a significant increase in load on your server due to external influences. Analytics services begin to register traffic records, and you could be happy, but you see that these “users” do not perform the actions that are expected of them, no matter what it is – studying content or shopping on the site.
You can spend a lot of time figuring out the reason, or you can just look at the access logs and check from which IPs and who visited your site in the selected time intervals. It is likely that you will find a large number of hits from multiple IP addresses, which were done automatically; that is, your site was under DDoS attack.
In this case, you can block access to the site from the selected IP and later expand this list, if necessary.
You may be interested in Unveiling the Top 5 Hosting Providers for Online Casinos.
Output
To date, server logs are a very handy tool that allows you to monitor the site, identifying bugs and errors, malicious users to counter DDoS attacks.
In order to work with server logs correctly, you need to know their location, be able to study the necessary files, as well as understand the different types of records. In most control panels, the user is immediately given the ability to enable and disable logging. In addition, it is possible to download or view logs.
In addition, a number of software can be found today, and they allow one to interact with information from logs through an easy-to-use graphical interface, deciphering it at great speed and displaying it in a simple way.
Linux-based systems tend to have log files in roughly the same location, which makes them very easy to work with.
Windows Server has its own graphical interface for reading the logs, which is very handy and allows you to quickly get the information you need.


 (7 оценок, среднее: 3.29 из 5)